In barrks, stations are references to specific raster cells. Thus, they
can be used to extract point-related data from a phenology. Look
here to find out which station-based functions are
available to analyse a phenology.
Usage
stations_create(station_names, cells)

stations_assign(pheno, stations)

stations_names(stations)

stations_cells(stations)
Arguments
- station_names
Character vector that specifies the names of the stations.
- cells
Numbers of the cells that should be represented by the stations.
- pheno
A phenology (see
phenology())- stations
Stations created with
stations_create()or obtained byprop_stations().
Value
stations_create(): A named numeric vector.stations_assign(): A phenology object (seephenology()).stations_names(): A character vector.stations_cells(): A numeric vector.
Functions
stations_create(): Create stations.stations_assign(): Assign stations to a phenology. Returns the phenology that was passed with respective stations assigned.stations_names(): Get the names of stations.stations_cells(): Get the raster cells of stations.
Examples
# \donttest{
# calculate phenology
p <- phenology('phenips-clim', barrks_data(), .quiet = TRUE)
# create stations and assign them to the phenology object
stations <- stations_create(c('station a', 'station b'),
c(234, 345))
p <- stations_assign(p, stations)
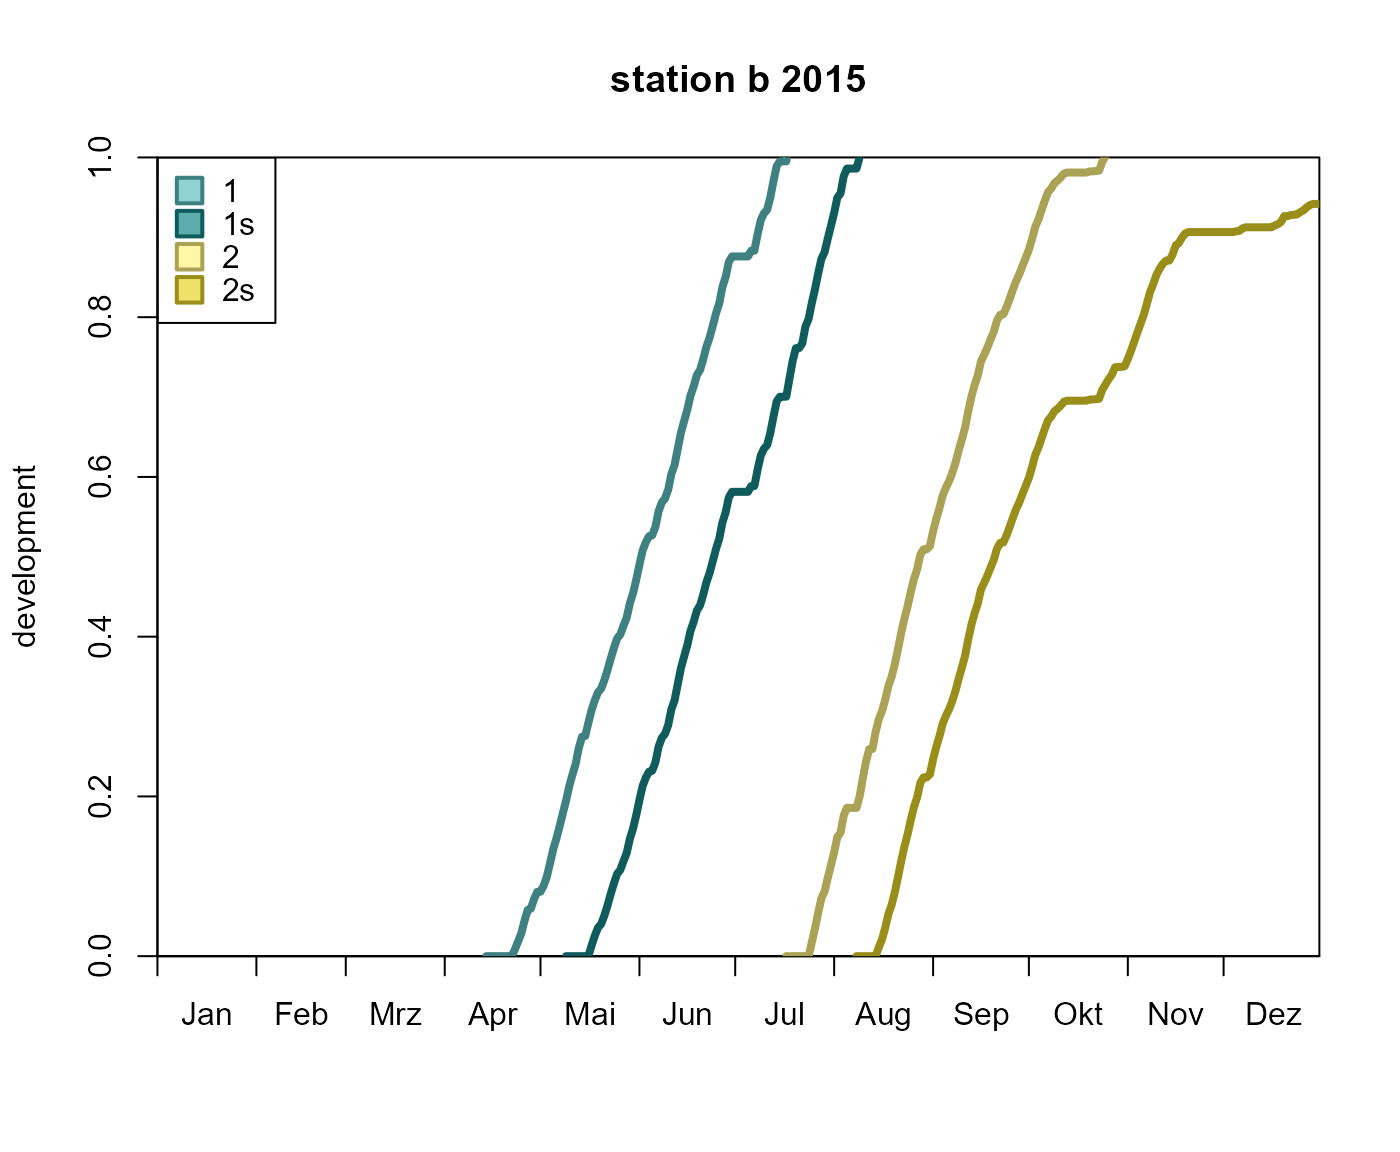
# plot the development of 'station b'
plot_development_diagram(p, 'station b', .lwd = 4, .legend_lty = FALSE)
 # }
# }