BSO works structurally differently than the other models in this
package. It stochastically simulates a multitude of individuals instead
of only returning a result for one representative beetle. Additionally,
it requires an hourly onset to function. This is why the BSO-specific
phenology function bso_phenology() exists. While it is
still possible to combine the diapause and the mortality submodels with
other models, this is not the case for the onset and development
submodels.
library(barrks)
library(tidyverse)
library(terra)


# function to unify the appearance of raster plots
my_rst_plot <- function(rst) {
  plot(rst, mar = c(0.2, 0.1, 2, 5),
       axes = FALSE, box = TRUE, nr = 1,
       cex.main = 1.9, plg = list(cex = 1.8))
}


pheno_bso <- bso_phenology('bso', barrks_data())
BSO-specific plots
As bso_phenology() returns a more detailed result than
phenology(), a few more functions are available for
illustration. The stage diagram illustrates the share of the total
individuals at a specific developmental stage.
station <- stations_create('station 1', 234)

bso_plot_stage_diagram(pheno_bso, station)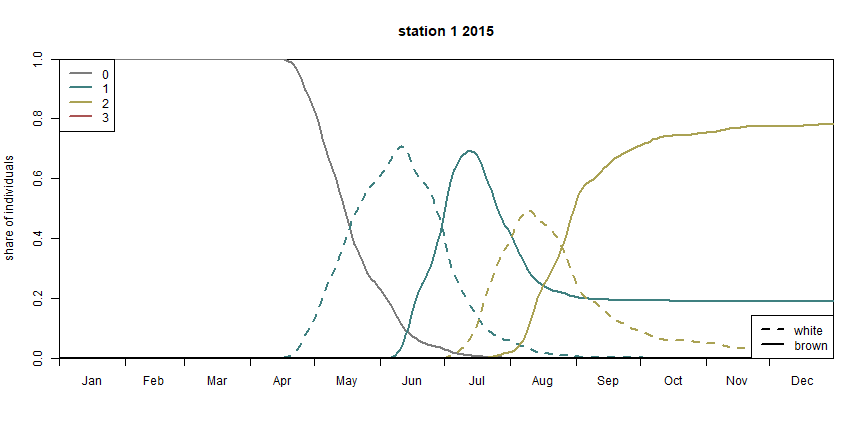
BSO stage diagram (the different colors represent the respective generation, generation ‘0’ stands for the hibernating beetles)
The flight diagram shows the relative flight activity at a specific date.
bso_plot_flight_diagram(pheno_bso, station)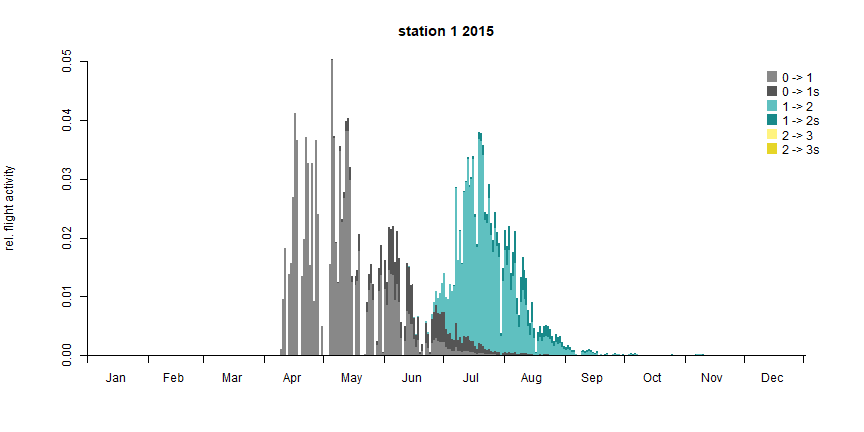
BSO flight diagram (the colors describe which generation flies to establish a new filial generation or a sister brood respectively)
Standard outputs
With bso_translate_phenology() it is possible to
translate the BSO-specific phenology to a form that corresponds to the
output of phenology(). This makes it possible to use
functions that are available to analyse phenology objects.
pheno_translated <- bso_translate_phenology(pheno_bso)

dates <- c('2015-04-15', '2015-06-15', '2015-08-15', '2015-10-15')
get_generations_rst(pheno_translated, dates) %>% my_rst_plot()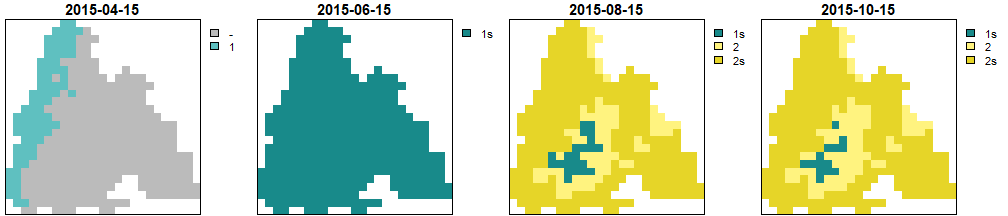
Generations calculated by BSO