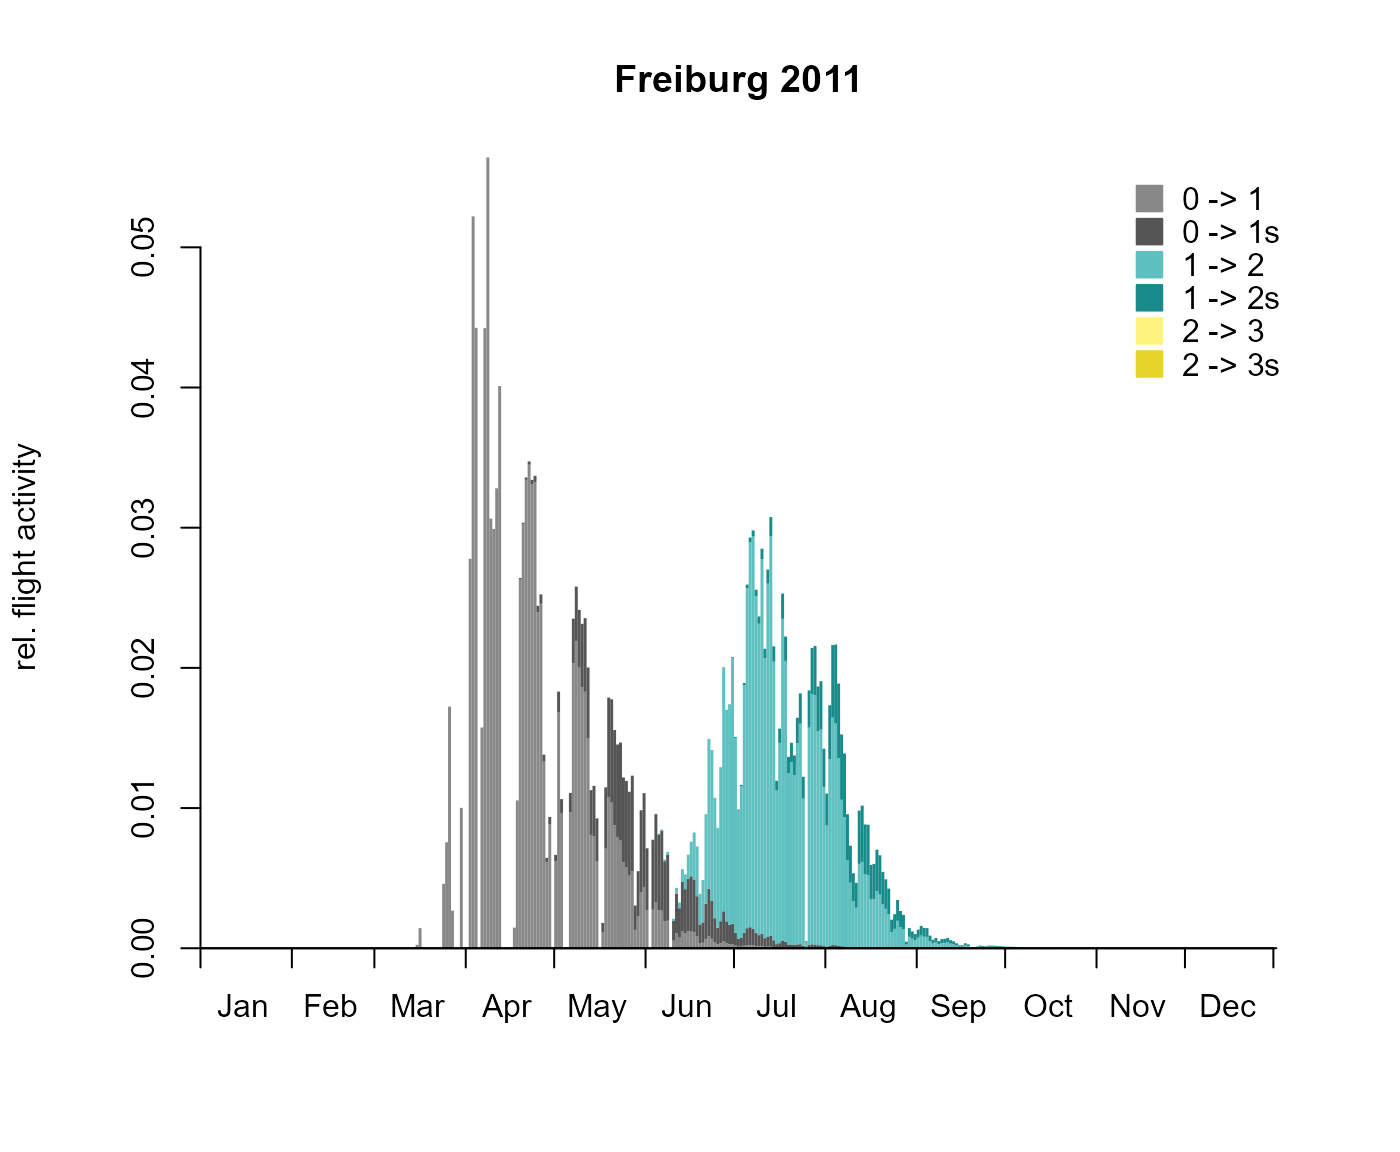
A flight diagram illustrates the daily share of flying individuals over time.
Usage
bso_plot_flight_diagram(
  .pheno,
  .station = prop_stations(.pheno)[1],
  .colors = barrks_colors("bso_flight"),
  .labels = barrks_labels("bso_flight"),
  .xlim = NULL,
  .legend = "topright",
  ...
)
Arguments
- .pheno
A BSO phenology (see
bso_phenology())- .station
Pass a character vector to choose a station assigned to
.phenoby its name, or pass a different station. Seestations_create()for details.- .colors, .labels
Vectors of colors/labels starting from the first and the second flght of the hibernating generation followed consecutively by elements for the filial generations (first and second flight).
- .xlim
Date vector of length to that limits the dates plotted.
- .legend
Pass
FALSEif no legend should be plotted. Otherwise the value will be passed tolegend()as first argument. Look there for more information.- ...
arguments passed to
graphics::barplot().
Examples
# \donttest{
# This may take a few minutes...

# calculate phenology
p <- bso_phenology('bso', barrks_data('stations'), .quiet = TRUE)

bso_plot_flight_diagram(p)

# }
# }