Find out how many generations are present (or have reached a development threshold).
Usage
get_generations_rst(
  pheno,
  dates = prop_last_date(pheno),
  threshold = 0,
  generations = prop_hatched_generations(pheno),
  categorical = TRUE,
  colors = barrks_colors("raster"),
  labels = barrks_labels("raster")
)

get_generations_df(
  pheno,
  stations = prop_stations(pheno),
  dates = prop_dates(pheno),
  threshold = 0,
  generations = prop_hatched_generations(pheno)
)

get_hibernating_generations_rst(
  pheno,
  categorical = TRUE,
  colors = barrks_colors("raster"),
  labels = barrks_labels("raster")
)

get_hibernating_generations_df(pheno, stations = prop_stations(pheno))
Arguments
- pheno
A phenology (see
phenology())- dates
Select dates that should be present in the output.
- threshold
Threshold of the beetle development to account for a generation.
- generations
Numeric vector that determines which generations should be included in the result.
- categorical
Set
FALSEif the SpatRaster that is returned should be numeric. Otherwise, it will be categorical.- colors, labels
Vectors of colors/labels starting from zero generations followed consecutively by elements for the respective generations (including sister broods).
- stations
Pass a character vector to choose stations assigned to
phenoby their names, or pass different stations. Seestations_create()for details.
Value
get_generations_rst(): A multi-layer SpatRaster.get_hibernating_generations_rst(): A SpatRaster. Only available if a mortality event has occured since the diapause started or the model's end date has been reached. Otherwise, the values will beNA.get_generations_df(): A data frame.get_hibernating_generations_df(): A data frame. Only available if a mortality event has occured since the diapause started or the model's end date has been reached. Otherwise, the values will beNA.
Examples
# \donttest{
# calculate phenology
p <- phenology('phenips-clim', barrks_data(), .quiet = TRUE)
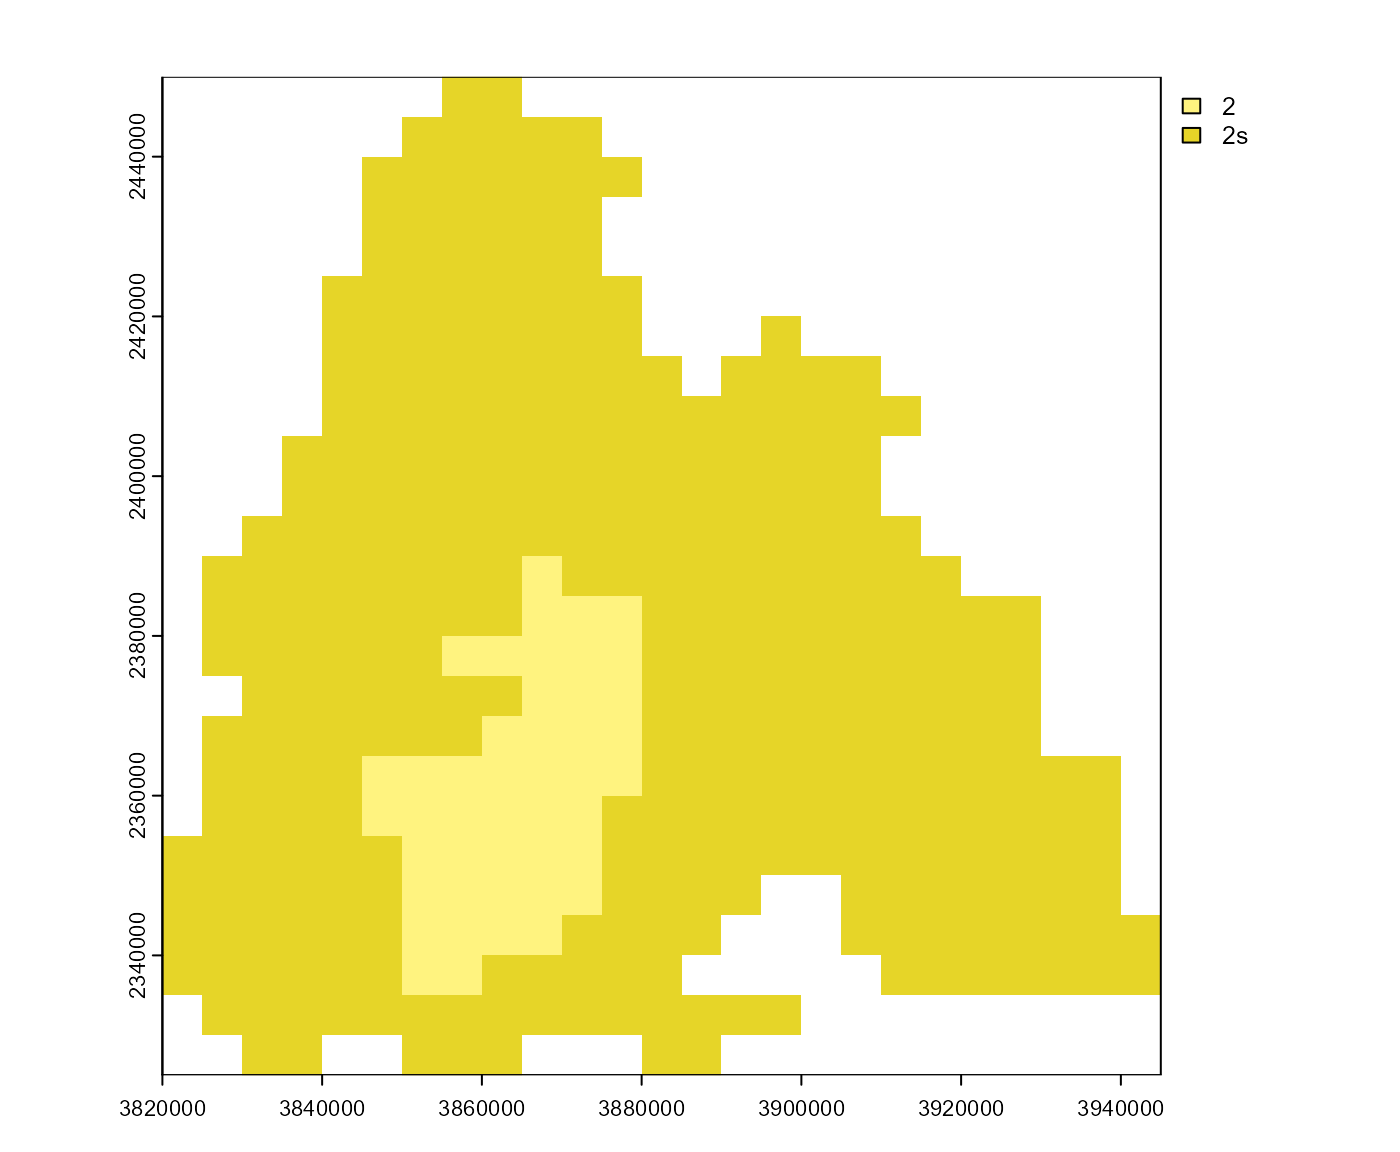
# get the generations raster
gens <- get_generations_rst(p)
# plot the generations raster
terra::plot(gens)
 # }
# }